1. Panel types for dashboards
原文:https://docs.gitlab.com/ee/operations/metrics/dashboards/panel_types.html
- Area or Line Chart
- Anomaly chart
- Bar chart
- Column chart
- Stacked column
- Single Stat
- Percentile based results
- Heatmaps
2. Panel types for dashboards
监视仪表板中支持以下面板类型.
2.1. Area or Line Chart
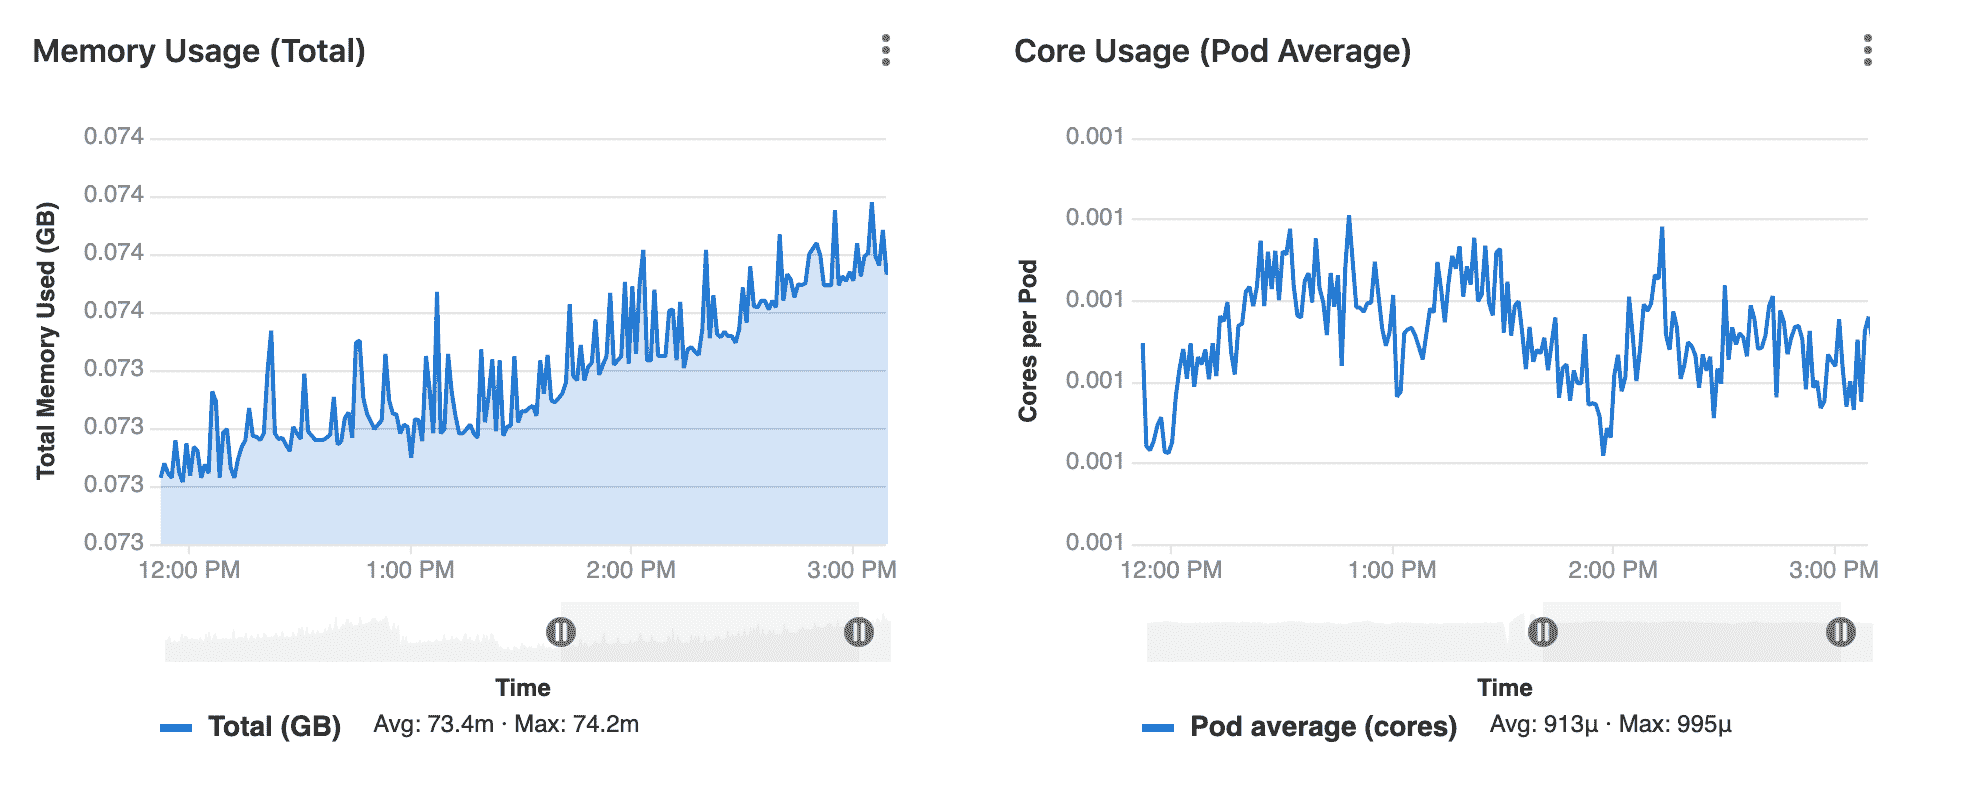
要将面积图面板类型添加到仪表盘,请查看以下样本仪表盘文件:
dashboard: 'Dashboard  Title'
panel_groups:
  - group: 'Group  Title'
    panels:
      - type: area-chart # or line-chart
        title: 'Area  Chart  Title'
        y_label: "Y-Axis"
        y_axis:
          format: number
          precision: 0
        metrics:
          - id: area_http_requests_total
            query_range: 'http_requests_total'
            label: "Instance:  {{instance}},  Method:  {{method}}"
            unit: "count"
请注意以下属性:
| Property | Type | Required | Description |
|---|---|---|---|
| type | string | no | 要渲染的面板类型. 区域面板类型的可选 |
| query_range | string | required | 对于区域面板类型,必须使用[范围查询](https://s0prometheus0io.icopy.site/docs/prometheus/latest/querying/api/) |
从版本 12.8开始,y 轴值将根据数据自动缩放. 以前,它总是从 0 开始.
2.2. Anomaly chart
在 GitLab 12.5 中引入 .
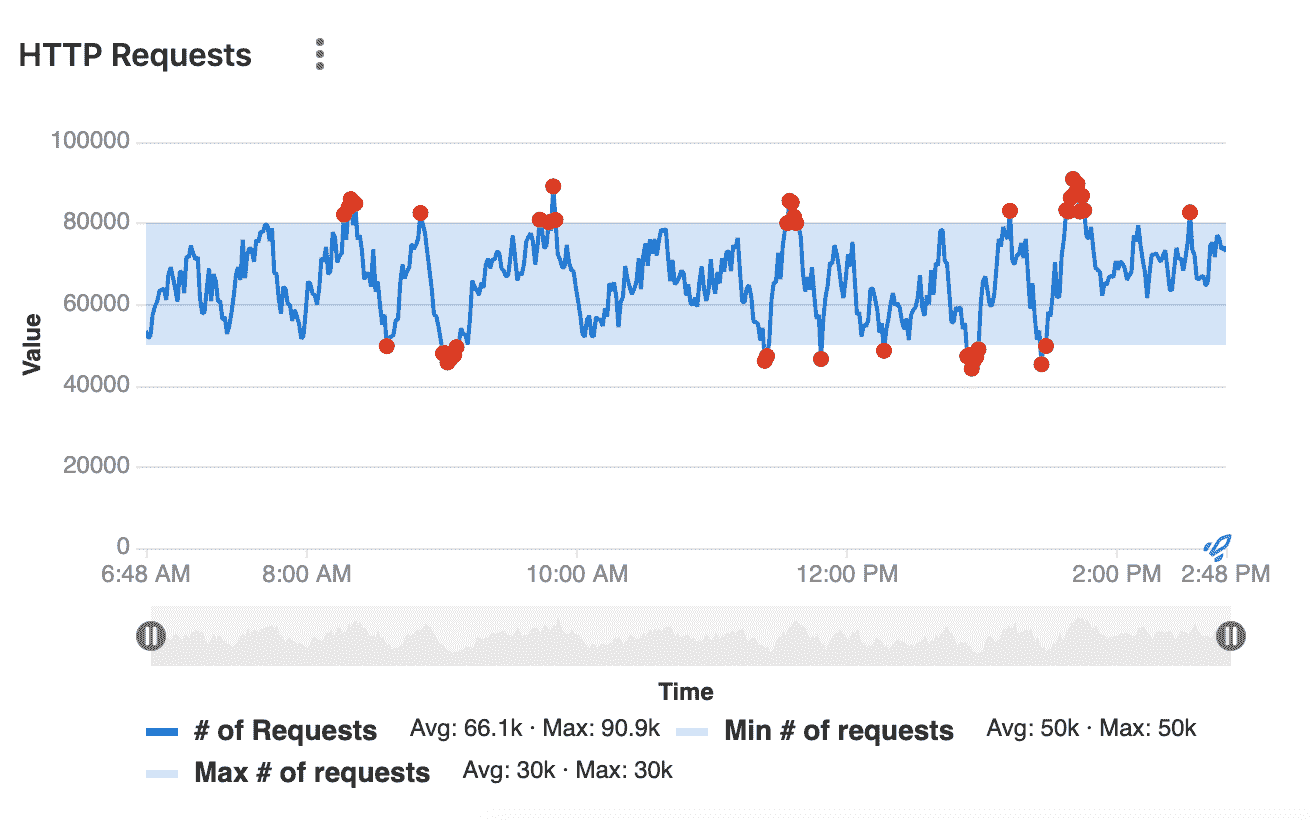
要将异常图表面板类型添加到仪表盘,请添加恰好具有 3 个指标的面板.
第一个指标代表当前状态,第二个和第三个指标分别代表上限和下限:
dashboard: 'Dashboard  Title'
panel_groups:
  - group: 'Group  Title'
    panels:
      - type: anomaly-chart
        title: "Chart  Title"
        y_label: "Y-Axis"
        metrics:
          - id: anomaly_requests_normal
            query_range: 'http_requests_total'
            label: "#  of  Requests"
            unit: "count"
        metrics:
          - id: anomaly_requests_upper_limit
            query_range: 10000
            label: "Max  #  of  requests"
            unit: "count"
        metrics:
          - id: anomaly_requests_lower_limit
            query_range: 2000
            label: "Min  #  of  requests"
            unit: "count"
请注意以下属性:
| Property | Type | Required | Description |
|---|---|---|---|
| type | string | required | 异常面板类型必须为`anomaly-chart` |
| query_range | yes | required | 对于异常面板类型,必须在每个指标中使用[范围查询](https://s0prometheus0io.icopy.site/docs/prometheus/latest/querying/api/) . |
2.3. Bar chart
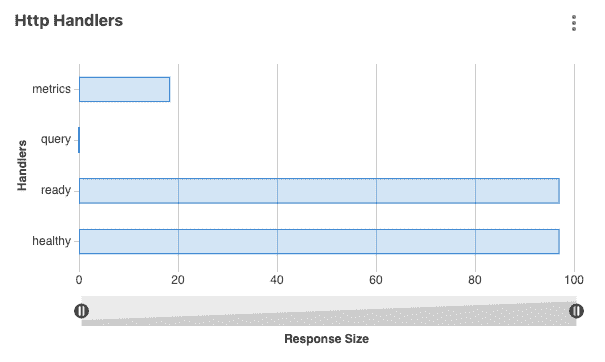
要将条形图添加到仪表板,请查看以下样本仪表板文件:
dashboard: 'Dashboard  Title'
panel_groups:
  - group: 'Group  title'
    panels:
      - type: bar
        title: "Http  Handlers"
        x_label: 'Response  Size'
        y_axis:
          name: "Handlers"
        metrics:
          - id: prometheus_http_response_size_bytes_bucket
            query_range: "sum(increase(prometheus_http_response_size_bytes_bucket[1d]))  by  (handler)"
            unit: 'Bytes'
请注意以下属性:
| Property | Type | Required | Description |
|---|---|---|---|
| `type` | string | yes | 要渲染的面板类型. 对于条形图类型,设置为`bar` |
| `query_range` | yes | yes | 对于条形图,必须使用[范围查询](https://s0prometheus0io.icopy.site/docs/prometheus/latest/querying/api/) |
2.4. Column chart
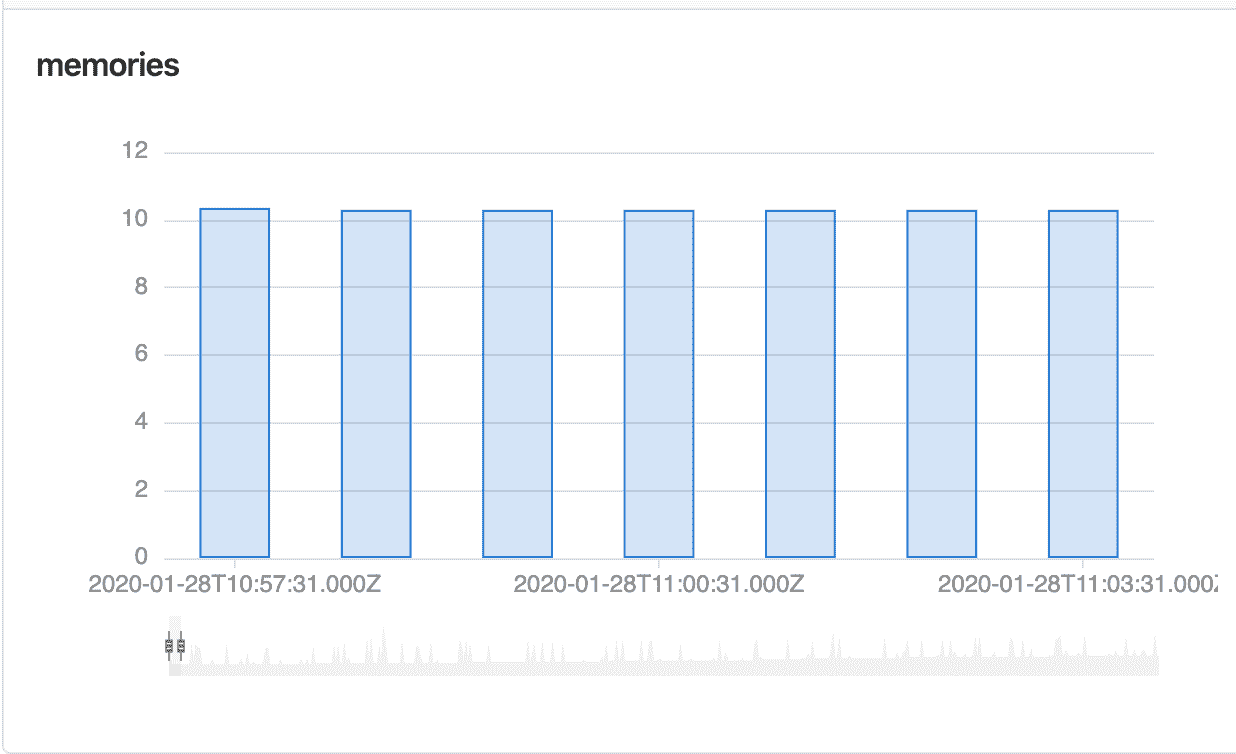
要将列面板类型添加到仪表板,请查看以下样本仪表板文件:
dashboard: 'Dashboard  Title'
panel_groups:
  - group: 'Group  title'
    panels:
      - title: "Column"
        type: "column"
        metrics:
        - id: 1024_memory
          query: 'avg(sum(container_memory_usage_bytes{container_name!="POD",pod_name=~"^%{ci_environment_slug}-([^c].*|c([^a]|a([^n]|n([^a]|a([^r]|r[^y])))).*|)-(.*)",namespace="%{kube_namespace}"})  by  (job))  without  (job)  /  count(avg(container_memory_usage_bytes{container_name!="POD",pod_name=~"^%{ci_environment_slug}-([^c].*|c([^a]|a([^n]|n([^a]|a([^r]|r[^y])))).*|)-(.*)",namespace="%{kube_namespace}"})  without  (job))  /1024/1024'
          unit: MB
          label: "Memory  Usage"
请注意以下属性:
| Property | Type | Required | Description |
|---|---|---|---|
| type | string | yes | 要渲染的面板类型. 对于列面板类型,设置为`column` |
| query_range | yes | yes | 对于列面板类型,必须使用[范围查询](https://s0prometheus0io.icopy.site/docs/prometheus/latest/querying/api/) |
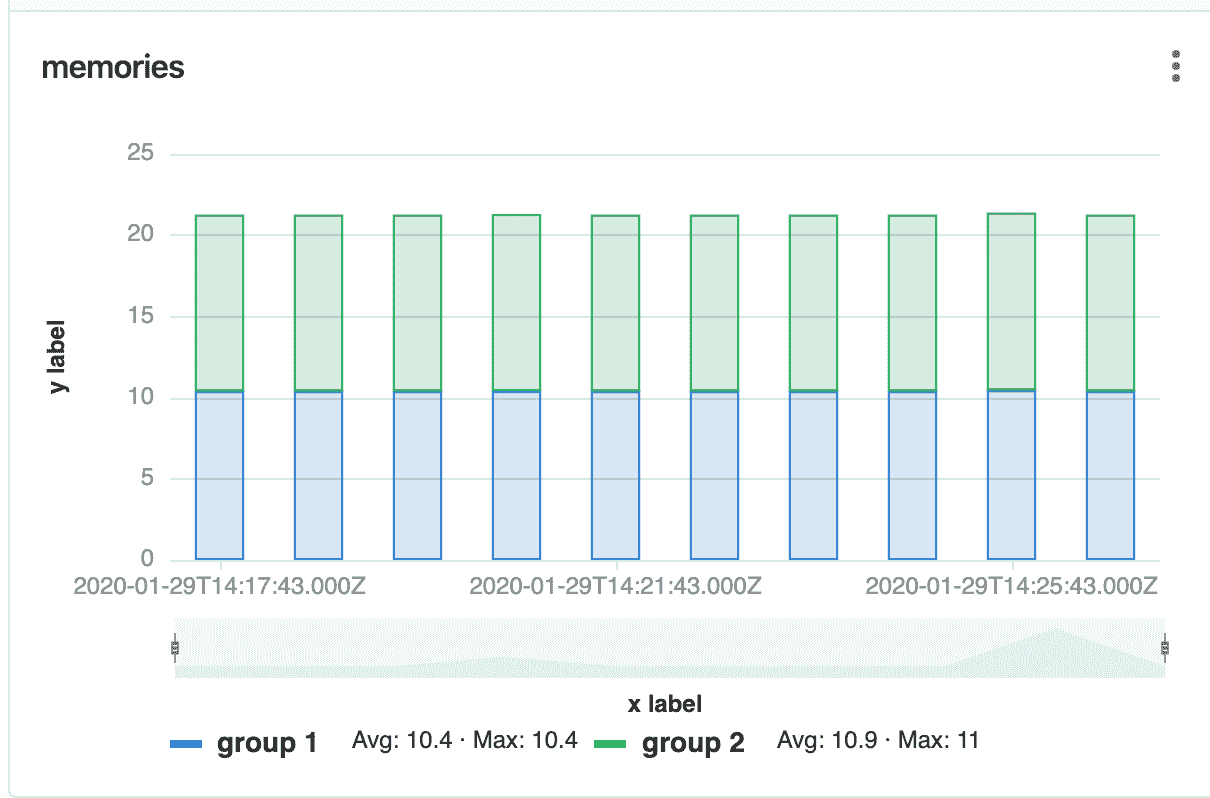
2.5. Stacked column
在 GitLab 12.8 中引入 .
要将堆叠的列面板类型添加到仪表板,请查看以下样本仪表板文件:
dashboard: 'Dashboard  title'
priority: 1
panel_groups:
  - group: 'Group  Title'
    priority: 5
    panels:
      - type: 'stacked-column'
        title: "Stacked  column"
        y_label: "y  label"
        x_label: 'x  label'
        metrics:
          - id: memory_1
            query_range: 'memory_query'
            label: "memory  query  1"
            unit: "count"
            series_name: 'group  1'
          - id: memory_2
            query_range: 'memory_query_2'
            label: "memory  query  2"
            unit: "count"
series_name: 'group 2' | Property | Type | Required | Description |
|---|---|---|---|
| `type` | string | yes | 要渲染的面板类型. 对于堆叠式柱面板类型,设置为" `stacked-column` |
| `query_range` | yes | yes | 对于堆叠式列面板类型,必须使用[范围查询](https://s0prometheus0io.icopy.site/docs/prometheus/latest/querying/api/) |
2.6. Single Stat
要将单个状态面板类型添加到仪表板,请查看以下样本仪表板文件:
dashboard: 'Dashboard  Title'
panel_groups:
  - group: 'Group  Title'
    panels:
      - title: "Single  Stat"
        type: "single-stat"
        metrics:
          - id: 10
            query: 'max(go_memstats_alloc_bytes{job="prometheus"})'
            unit: MB
            label: "Total"
请注意以下属性:
| Property | Type | Required | Description |
|---|---|---|---|
| type | string | yes | 要渲染的面板类型. 对于单一统计信息面板类型,设置为`single-stat` |
| field | string | no | 面板显示指标的值. 要使面板显示标签的值,请在该键中放置标签的名称. |
| query | string | yes | For single stat panel types, you must use an [instant query](https://s0prometheus0io.icopy.site/docs/prometheus/latest/querying/api/) |
2.7. Percentile based results
在 GitLab 12.8 中引入 .
有时需要将查询结果表示为 100 中的百分比值.您可以在面板定义的根部使用max_value属性:
dashboard: 'Dashboard  Title'
panel_groups:
  - group: 'Group  Title'
    panels:
      - title: "Single  Stat"
        type: "single-stat"
        max_value: 100
        metrics:
          - id: 10
            query: 'max(go_memstats_alloc_bytes{job="prometheus"})'
            unit: '%'
label: "Total" 例如,如果查询值为53.6 ,则将%添加为单位将得出53.6%的单个统计值,但是如果查询的最大期望值为120 ,则该值为44.6% . 添加max_value会导致显示正确的百分比值.
2.8. Heatmaps
在 GitLab 12.5 中引入 .
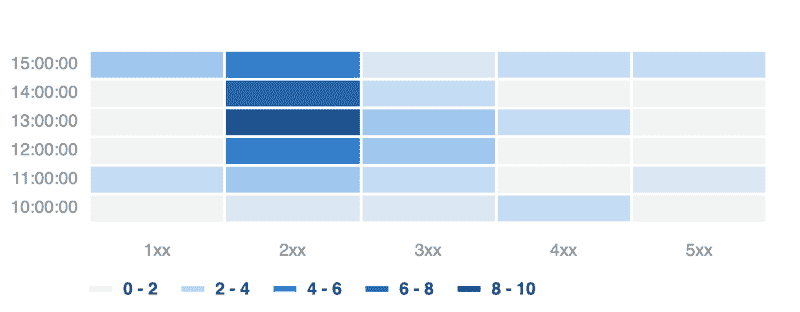
要将热图面板类型添加到仪表板,请查看以下样本仪表板文件:
dashboard: 'Dashboard  Title'
panel_groups:
  - group: 'Group  Title'
    panels:
      - title: "Heatmap"
        type: "heatmap"
        metrics:
          - id: 10
            query: 'sum(rate(nginx_upstream_responses_total{upstream=~"%{kube_namespace}-%{ci_environment_slug}-.*"}[60m]))  by  (status_code)'
            unit: req/sec
            label: "Status  code"
请注意以下属性:
| Property | Type | Required | Description |
|---|---|---|---|
| type | string | yes | 要渲染的面板类型. 对于热图面板类型,设置为`heatmap` |
| query_range | yes | yes | 对于区域面板类型,必须使用[范围查询](https://s0prometheus0io.icopy.site/docs/prometheus/latest/querying/api/) |
警告:当查询返回太多数据点时,热图数据桶的尺寸趋于向下至 0,从而使图表的数据不可见,如下图所示. 要解决此问题,请通过更改指标仪表板 UI 上的时间范围过滤器,或将step属性添加到仪表板的 YAML 文件中,来限制返回的数据量.
